Plan View
We find consultants, facility managers and maintenance engineers LOVE zencontrol’s ‘Plan View technology.
Free Plan View
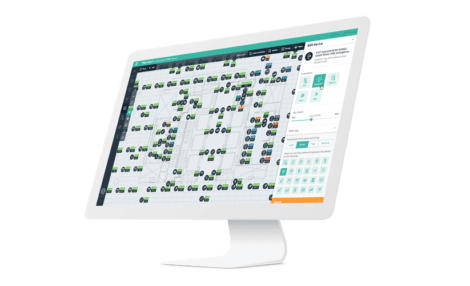 ‘Plan View’ comes free with any zencontrol system. Clients with zencontrol on their sites are provided with a standard Cloud subscription and user logins to that account. Plan View works on PC, Mac and Android or Apple tablets. Multiple users can be set up, allowing interaction with the building by each simultaneously.
Once logged in to the zencontrol Cloud, the user can then head to the Plan View page and view the live status of their building. For instance, they can:
- View the building via easily recognised, site-specific floorplans;
- View DALI-2 devices (lighting drivers, sensors, switches, etc), their location in the building, their IDs, groups and status;
- Control lighting functions e.g. light levels, maximum and minimum outputs and more.
Details such as manufacturers descriptions or codes can be assigned to each light fitting for easier maintenance and reporting.
Commissioning dates are recorded for each device making it simple to assess “under warranty” or “out of warranty” failures.
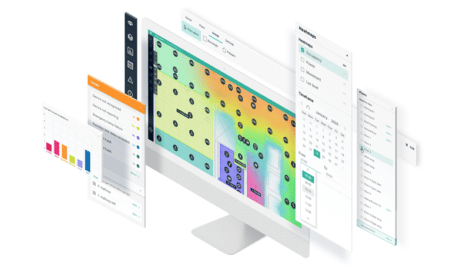 For commissioning purposes, any “issues” are also highlighted. It enables a user to understand the current state of building devices at a glance. The data is collected in real-time, regardless of the building size. Issues can quickly be identified on the plan and rectified quickly.
Upgrade For More Functionality
Upgrades can be added at any time, without the need for additional commissioning or hardware.
“Add-ons” currently available for increased functionality include:
- Faults and issues
- Power
- Heatmaps
Faults and Issues
After 12 months the “issues” dashboard provided for commissioning purposes is no longer visible. However, there is now an option to upgrade your plan and pay an annual subscription to maintain visibility of the issues dashboard. Issues are colour coded and can be highlighted, enabling your facility maintenance team to quickly identify and provide the necessary remedial action to deal with both urgent critical issues and routine maintenance.
Data can be gathered from almost every device in the building, including sensors, switches, lighting, emergency devices and controllers.
Whereas ‘Free Plan View’ shows only the current ‘live’ status of the building, with an upgraded plan data can be stored on Amazon managed web servers, and then analysed and transformed via user-friendly dashboards to help stakeholders understand the performance of their building.
Power
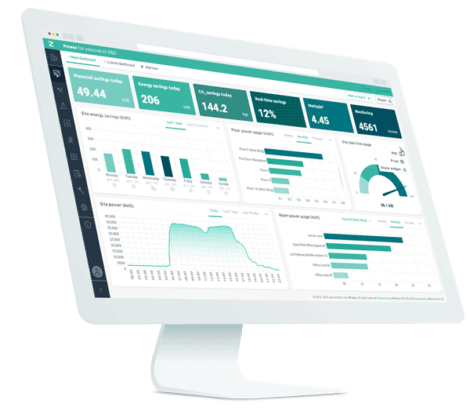 The Cloud infrastructure combined with Plan View visualisation tools provides valuable information to allow facility managers and building owners to understand and adjust their building’s power usage.
zencontrol DALI application controllers collect data on power consumption from each compatible light fitting, switch and sensor in 15-minute blocks. This data is then streamed to the Cloud for processing, storage, and visualisation.
These data powerpoints can be used to:
- Identify areas of high-power consumption
- Target high consuming areas to maximise electricity reduction measures
- Employ control strategies to reduce power consumption
- Track the performance of changes
- Understand the performance of the building by fitting, room, floor, or departments
- See the benefit of features such as task tuning or daylight harvesting
- Identify lighting which is not turned off when it could be, and make changes
- Works with Tridonic PRE-devices, zencontrol drivers and DALI devices supporting DALI Device Type 50 without additional commissioning
- Supports older DALI compliant devices through interpolation
Heatmaps
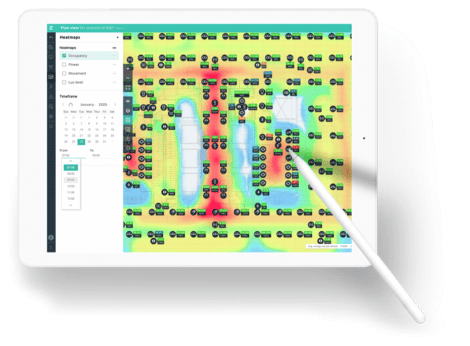 Heatmaps can be used to identify power usage, potential problems, and high/low occupancy.
- Lux Level Heatmaps – can identify areas that can be fine-tuned for greater savings with lux level and use-case mapping
- Occupancy Heatmap – can be overlayed to understand the most utilised areas and the flow of people according to time of day. Different time periods can be selected and compared to indicate areas/timeframes that may need to be addressed. Occupancy heatmaps can assist in prioritising maintenance or redesigning of office space for maximum ROI.
Viewing a power heatmap over Plan View allows visibility of where power is being consumed. Organisations can then take appropriate steps to reduce power usage.
Read more about Plan View and the benefits available.
